The following is a response to the Fairmont City Council’s additional list of questions coming out of the November 9, 2022 workshop regarding the YMCA proforma. This response was submitted to the City by the FACC Foundation on January 27, 2023.
Thank you for your questions regarding the initial Fairmont YMCA proforma. The proforma is meant to be a working document using projections and assumptions. It incorporates community make-up, facility requirements, programming, local economy, work force, philanthropy, etc. It is a living document that can be adjusted and updated as necessary to reflect the evolving nature of the YMCA community center project. We have answered the questions to the best of our ability in writing, but a more thorough and complete discussion will be helpful during the follow-up, in-person workshop.
The YMCA has made statements that membership numbers decreased in 2020 with COVID and that memberships have not returned to pre-COVID numbers and members are utilizing the facility different.
- In the proforma the YMCA utilized 2019 data to form a benchmark for operations for a YMCA in Fairmont. If memberships have not returned to pre-COVID levels how is 2019 data a good data set for Fairmont operations? What if any adjustments are being made to this 2019 data to account for the decline in memberships seen since COVID?
- 2019 is currently a good data set reference for Fairmont operations because it does not include COVID relief dollars from the past several years which would skew the outputs.
- The statements made by Y representation about membership not yet returning to pre-covid numbers were generalized statements about state and national averages. Several Ys within the Northern Alliance, especially those with newer facilities, are over 100% pre covid membership numbers. Examples would include Hermantown MN, Austin MN, Winona MN, Southwood County WI, and Marshfield WI. At the time of the initial proforma development, it was agreed upon with the Y’s financial and market analyst, that using 2019 financial data was best so that we would not be including COVID relief dollars
- How are members utilizing the facility different in a post COVID environment?
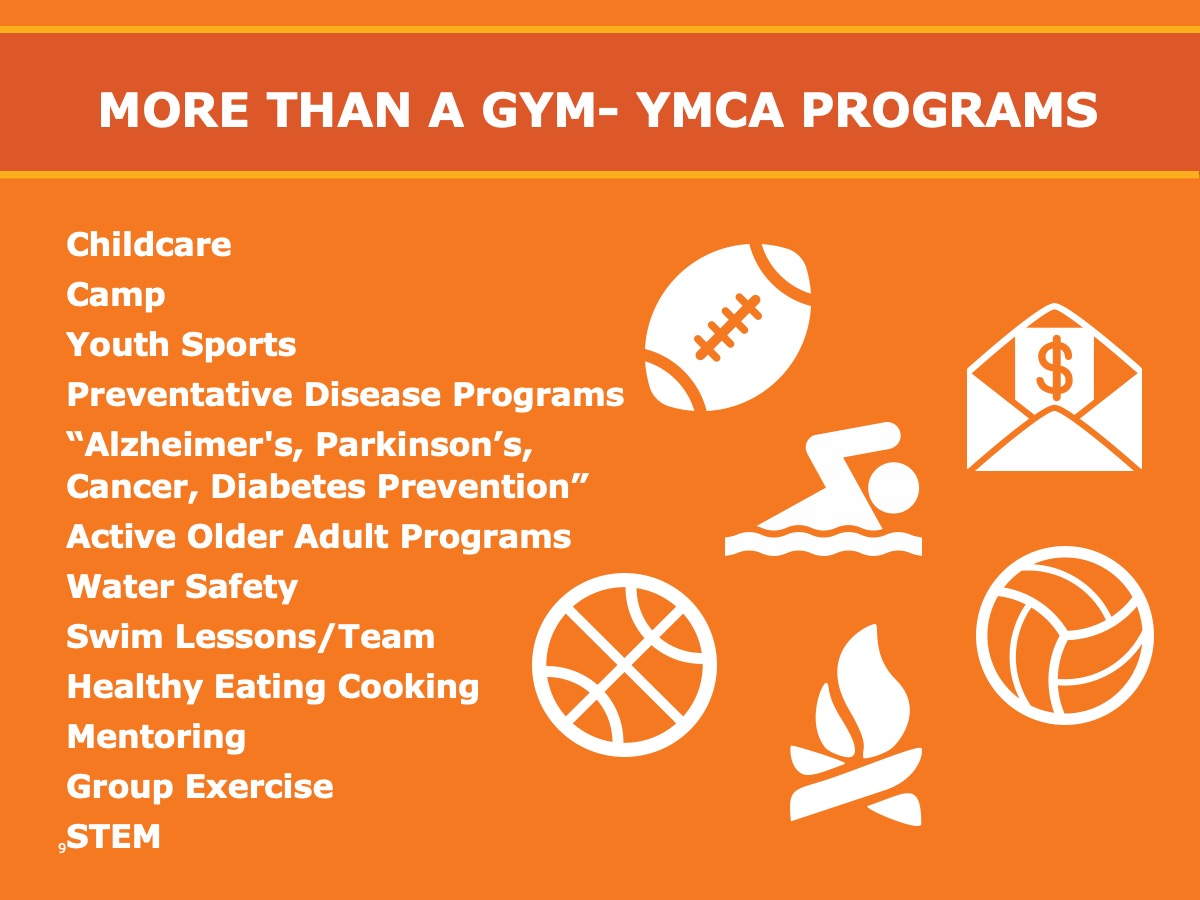
- Generally, we have seen less locker room usage, more virtual offerings, increased needs for senior programming, childcare, and increased demand for swim lessons, camp, youth sports, and evidence-based programming.
- If members are utilizing the facilities differently, is the standard 45,000 square foot YMCA floor plan the best conceptual design for our facility? Should adjustments be made to account for the changing use?
- Based on the current facility requirements as laid out by the City, the current 45k sqft design is about the minimum size to successfully operate and have financially sustainable operations. As we look to finalize design, the Y would request engaging “GRO”, their design development partner. GRO specializes in facility space and design optimization and would help make any necessary adjustments based on usage trends.
The YMCA has made statements that membership numbers decreased in 2020 with COVID and that memberships have not returned to pre-COVID numbers and members are utilizing the facility different.
- How did the YMCA decide these were the best benchmark communities for a YMCA in our community? What factors were taken into consideration with this decision?
-
- The benchmark cities were based on population and core market make-up for compatible city sizes within a 15-, 20- and 25-minute drive of Fairmont. (See attached for detailed insights data; population comparisons outlined below).
- Marshall 13,641 (2021 census data)
- Worthington 13,726
- Fergus Falls 14,029
- Brainerd 14,275
- Albert Lea 18,428
- 15-minute Radius of Fairmont 12,765
- 20-minute Radius of Fairmont 15,972
- 25-minute Radius of Fairmont 22,162
- Membership revenue for “college students” is focused on virtual learners and summer specials targeting students at home for the summer and is a conservative number. The estimates are not based on having a college in the community.
- It is also important to note that no “3rd party” insurance membership benefits revenues (e.g. “Silver Sneakers”) have been placed into the proforma
- The benchmark cities were based on population and core market make-up for compatible city sizes within a 15-, 20- and 25-minute drive of Fairmont. (See attached for detailed insights data; population comparisons outlined below).
-
- If we are going to utilize a community with a population over 8000 more than Fairmont, would it not make sense to then utilize a smaller community to create a balance when averaging the benchmarks to create the baseline for our operations? Why or why not?
- The population comparisons are based on a comparable market with 15–25-minute drive times from Fairmont, not its actual city population size of 10,410 (2021 data). They are market based. The Y’s experience is that significantly smaller market sizes are not adequate comparisons due to the wide programming and facility fluctuations.
- There are Ys in very small markets, however, (1,500 – 8,500 population) that are experiencing very positive results in both financial performance and community impact.
- Importantly, the success or failure of a local Y heavily depends on debt management, leadership, community support, and decision making.
- The anticipated memberships include 25 college student annual memberships in the first year and increasing to 70 annual college memberships in year five. The benchmark communities all have colleges so this would make sense for their operations, how do you conclude that Fairmont will have this many annual memberships for college students without a college in the town?
- As noted in 2a above, membership revenue for “college students” is focused on virtual learners and summer specials targeting students at home for the summer and is a conservative number. The estimates are not based on having a college in the community.
The YMCA proforma shows contributions of $180,000 to $260,000 per year for the first 5 years to support operations. This is in addition to the $400,000 per year shown for the first 5 years to build a $2M endowment to support operations and programing and the $20,000 – $40,000 per year forecasted for revenues from government contracts/grants. What information has been evaluated for fundraising in Fairmont to be confident that the YMCA can raise $180,000 – $260,000 on an annual basis to support operations?
- Comparative city benchmarks and the Y’s national benchmark of 15% of member household income being donated to charitable revenue were blended together with market data reflecting households >$500k value, HHI >$200k, number of businesses, overall households and giving rates to arrive at reasonable and realistic funding pool projections.
The proforma shows membership revenues in year one higher than one benchmark community and by year three being higher than three of the five benchmark communities. As each of these benchmark communities are larger than Fairmont, what are your planning factors for forecasting greater membership revenues for this YMCA?
- The benchmark cities are comparable in market size as noted in 2b above. Market area data, market make-up and the Y’s historical experience were all factored into the forecasting numbers. Continued analysis will be ongoing to ensure affordability and financially sustainable operations.
The proforma shows program service fee revenues ranging from $485,943 in year one to $590,666 in year five. The year one revenues in this category exceeds four of the five benchmark communities program service fee revenues. What are your planning factors for forecasting greater program service fee revenues for this YMCA?
- The benchmark cities are comparable in market size as noted in 2b above. The membership rates along with market area data, market make-up and the Y’s historical experience were all factored into the forecasting numbers. Continued analysis will be ongoing to ensure affordability and financially sustainable operations.
The proforma includes “occupancy” costs estimated at $4 per square foot. What is included in this expenditure line?
- Occupancy includes utilities (electric, gas, water), phone, internet, and other overhead costs. This was estimated at $4 per square foot on a 47,000 square foot facility with a 2.5% increase each year. Exact elements will depend upon a discussion involving building operations and ownership. These discussions are in the initial phases between the City and the Foundation.
How are routine maintenance costs planned to be covered?
- It is anticipated that routine maintenance costs (such as facility cleaning, removing trash, general appearance upkeep, etc.) will be the responsibility of the Y, while outside landscaping upkeep, snow removal, etc. will be the responsibility of the City. Repairing items that are broken, such as maintaining electrical systems, heating and air conditioning systems, and other utility services, etc. will depend upon a discussion involving building operations and ownership. These discussions are in the initial phases between the City and the Foundation.
How does the Foundation/YMCA plan to cover capital maintenance needs of the facility?
- Capital maintenance expenditures, or the cost of renewing, replacing, rehabilitating, refurbishing or restoring assets to ensure that services continue at the same level of performance that was first delivered, will depend upon a discussion involving building operations and ownership. These discussions are in the initial phases between the City and the Foundation.
